
IBM Security Verify Appliance Web Services
04 March, 2021, by Paul Kennedy
If you have deployed an IBM Security Verify appliance, whether that is Governance, Access or Identity Manager, you may have asked yourself these questions:
- Ever wanted to automate the processes used to manage your IBM Security Verify Appliances?
- Ever wanted to script the configuration of a deployment?
- Ever wanted to automate diagnostic checking of your environment?
If the answer to any of these questions is yes, then you need to take a look at the REST APIs provided with IBM's latest suite of appliances.
WHERE CAN I FIND INFORMATION ON THESE WEB SERVICES?
Rather than hunt the IBM website for REST API documentation, each appliance ships with the documentation appropriate for that particular appliance already! It can be found under the Help option at the top of the screen.
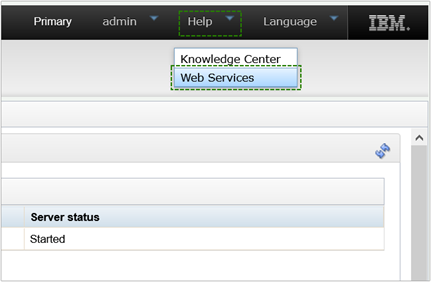
Selecting the Web Services link will launch the REST API documentation in a separate pop-up window.
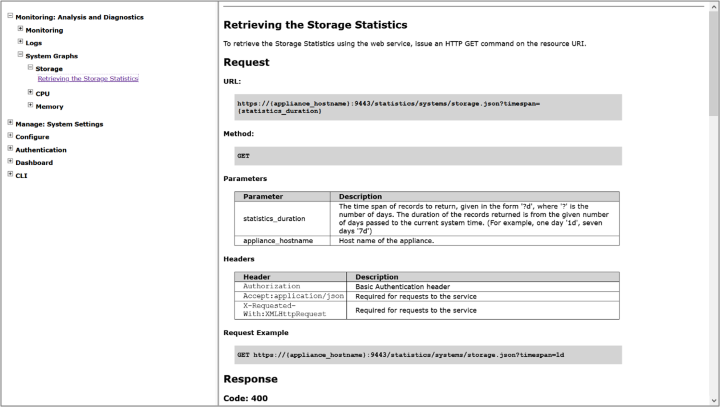
Handily, the functions that you may want to invoke have been categorised according to function such as: Monitoring, Log File Management, Appliance Configuration and even the ability to Install Fix Packs.
LET’S PLAY!
Using our favourite API Development platform, Postman, we can quickly and simply test our APIs.
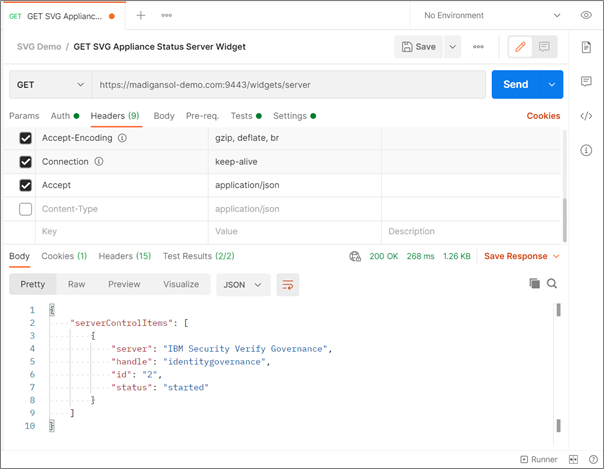
As you can see, the call to the /widgets/server API end-point produces a JSON object response which states that the server instance is in a started state. Postman handily provides us with a means of testing the response that we get. In our example, we can test that the status attribute within the response contains the word started using code similar to this:
let jsonData = pm.response.json();
pm.test("Test for status of ISVG started", () => {
    pm.expect(jsonData.serverControlItems[0].status).to.be.eql("started")
})
A STEP FURTHER
Of course, Postman is great for testing our theories but we may want to invoke these operations from a shell script or command line. If we wanted to continually poll our appliance to determine the CPU usage over time, for example, we could issue the following command:
curl -k --user ${USER_CREDS} -H Content-type:application/json -H Accept:application/json -s -X GET https://${FQDN}:${HTTPS_PORT}/statistics/systems/cpu.jsonThe JSON response, as before, could be easily captured and committed to disk, database or any other consuming service:
{
    "user_cpu": "2.60",
    "system_cpu": "0.51",
    "idle_cpu": "96.89",
    "label": null,
    "dateMinMaxDiff": null,
    "ymax": null,
    "items": null
}
Now, we have a means of capturing CPU usage statistics, over time, in a manner which will help us not just capture the statistics, but also report on those statistics in graphs and charts for presentation at Service Review meetings or as part of capacity planning exercises.
ANOTHER LEVEL AGAIN
These Web Services enable us to incorporate them into our operational and reporting processes, such as:
- Change & Configuration Management/Verification
- Health & Sanity Checking
- BI Reporting
- System Monitoring
And with BI Reporting tools you can leverage these Web Services to create Reports and Dashboards for further analysis and reporting.